Visualize: Grafana
Transitive integrates Grafana for visualization and alerting. As with ClickHouse, Transitive users, both on the hosted solution and self-hosted, have "Editor" access to a designated organization on Grafana. The URL and credentials can be found on the Security page.
But the integration between Transitive and Grafana goes deeper than merely hosting a Grafana instance and providing access.
Designated User Organizations
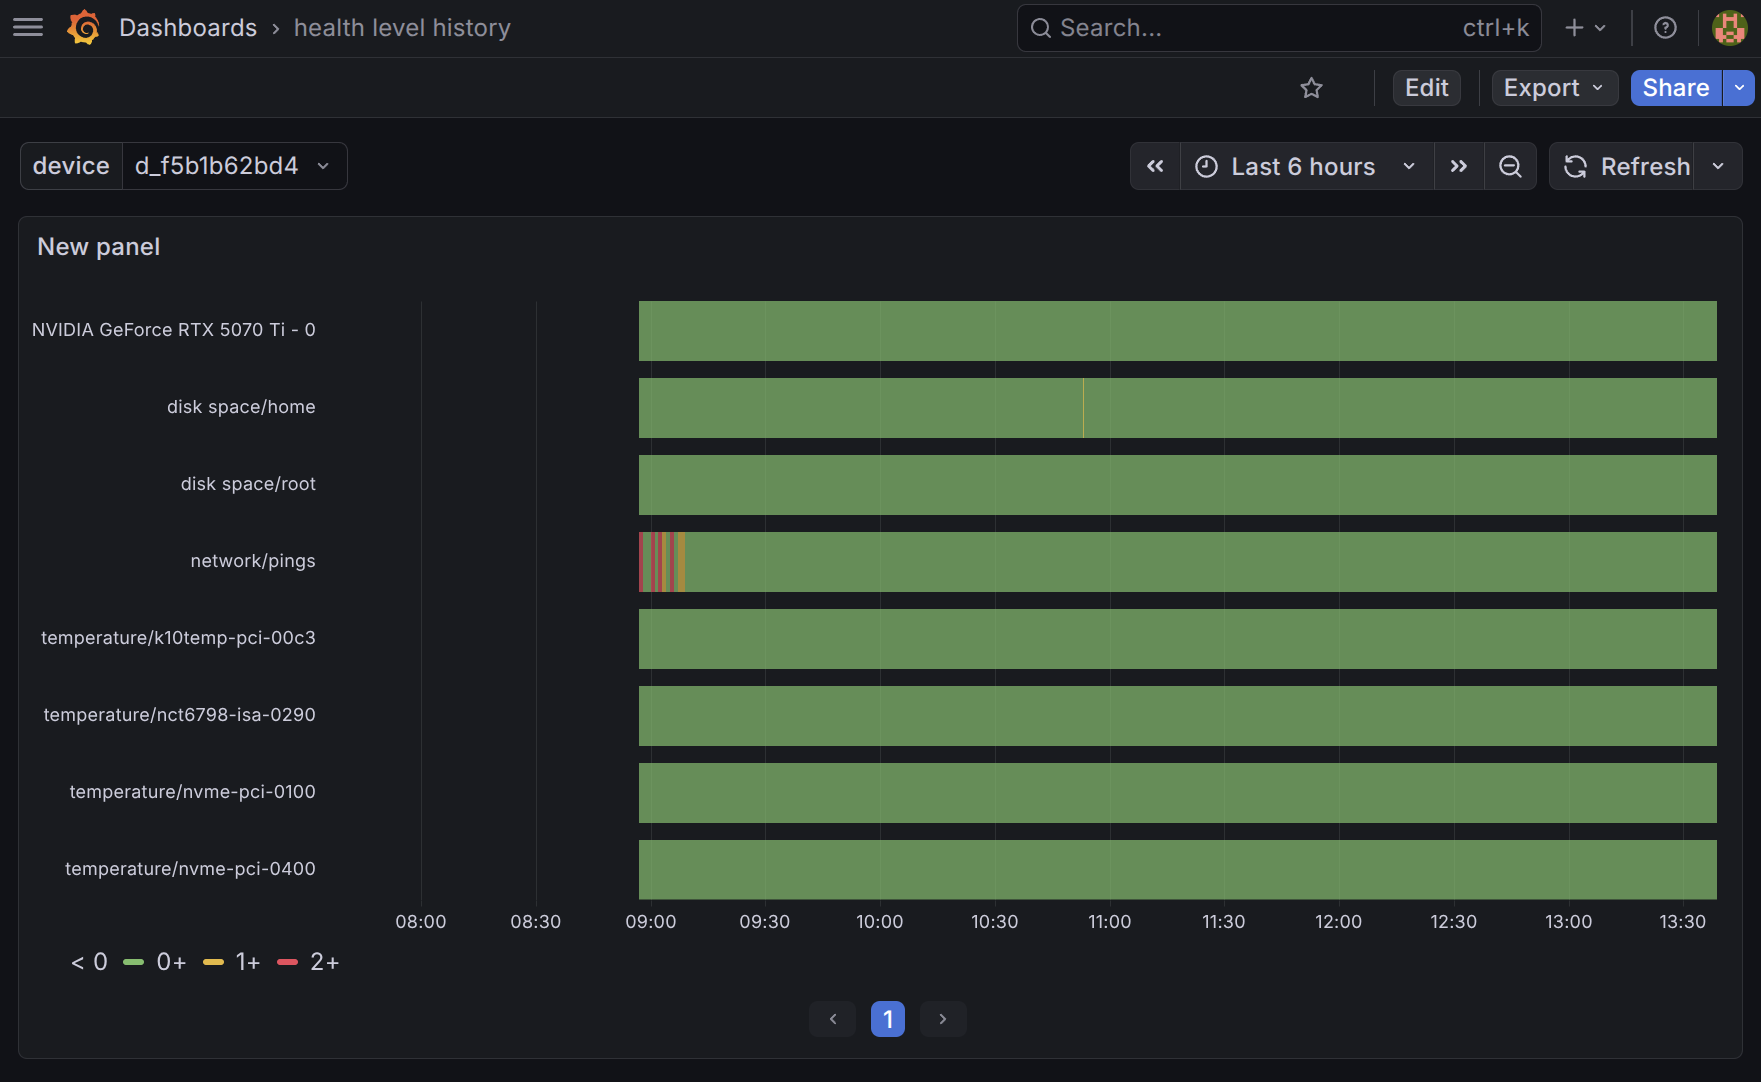
Each account is provisioned with a pre-configured ClickHouse datasource, using the access-controlled credentials described in the previous section. This means that you can start exploring all your MQTTSync and other, capability-specific data in Grafana right away. As we will see in the next section, this is particularly useful for defining alerts. But you can also use it to define your own, custom dashboards like this one showing the health level history of your robots, using data collected by the Health Monitoring capability.
MQTTSync History
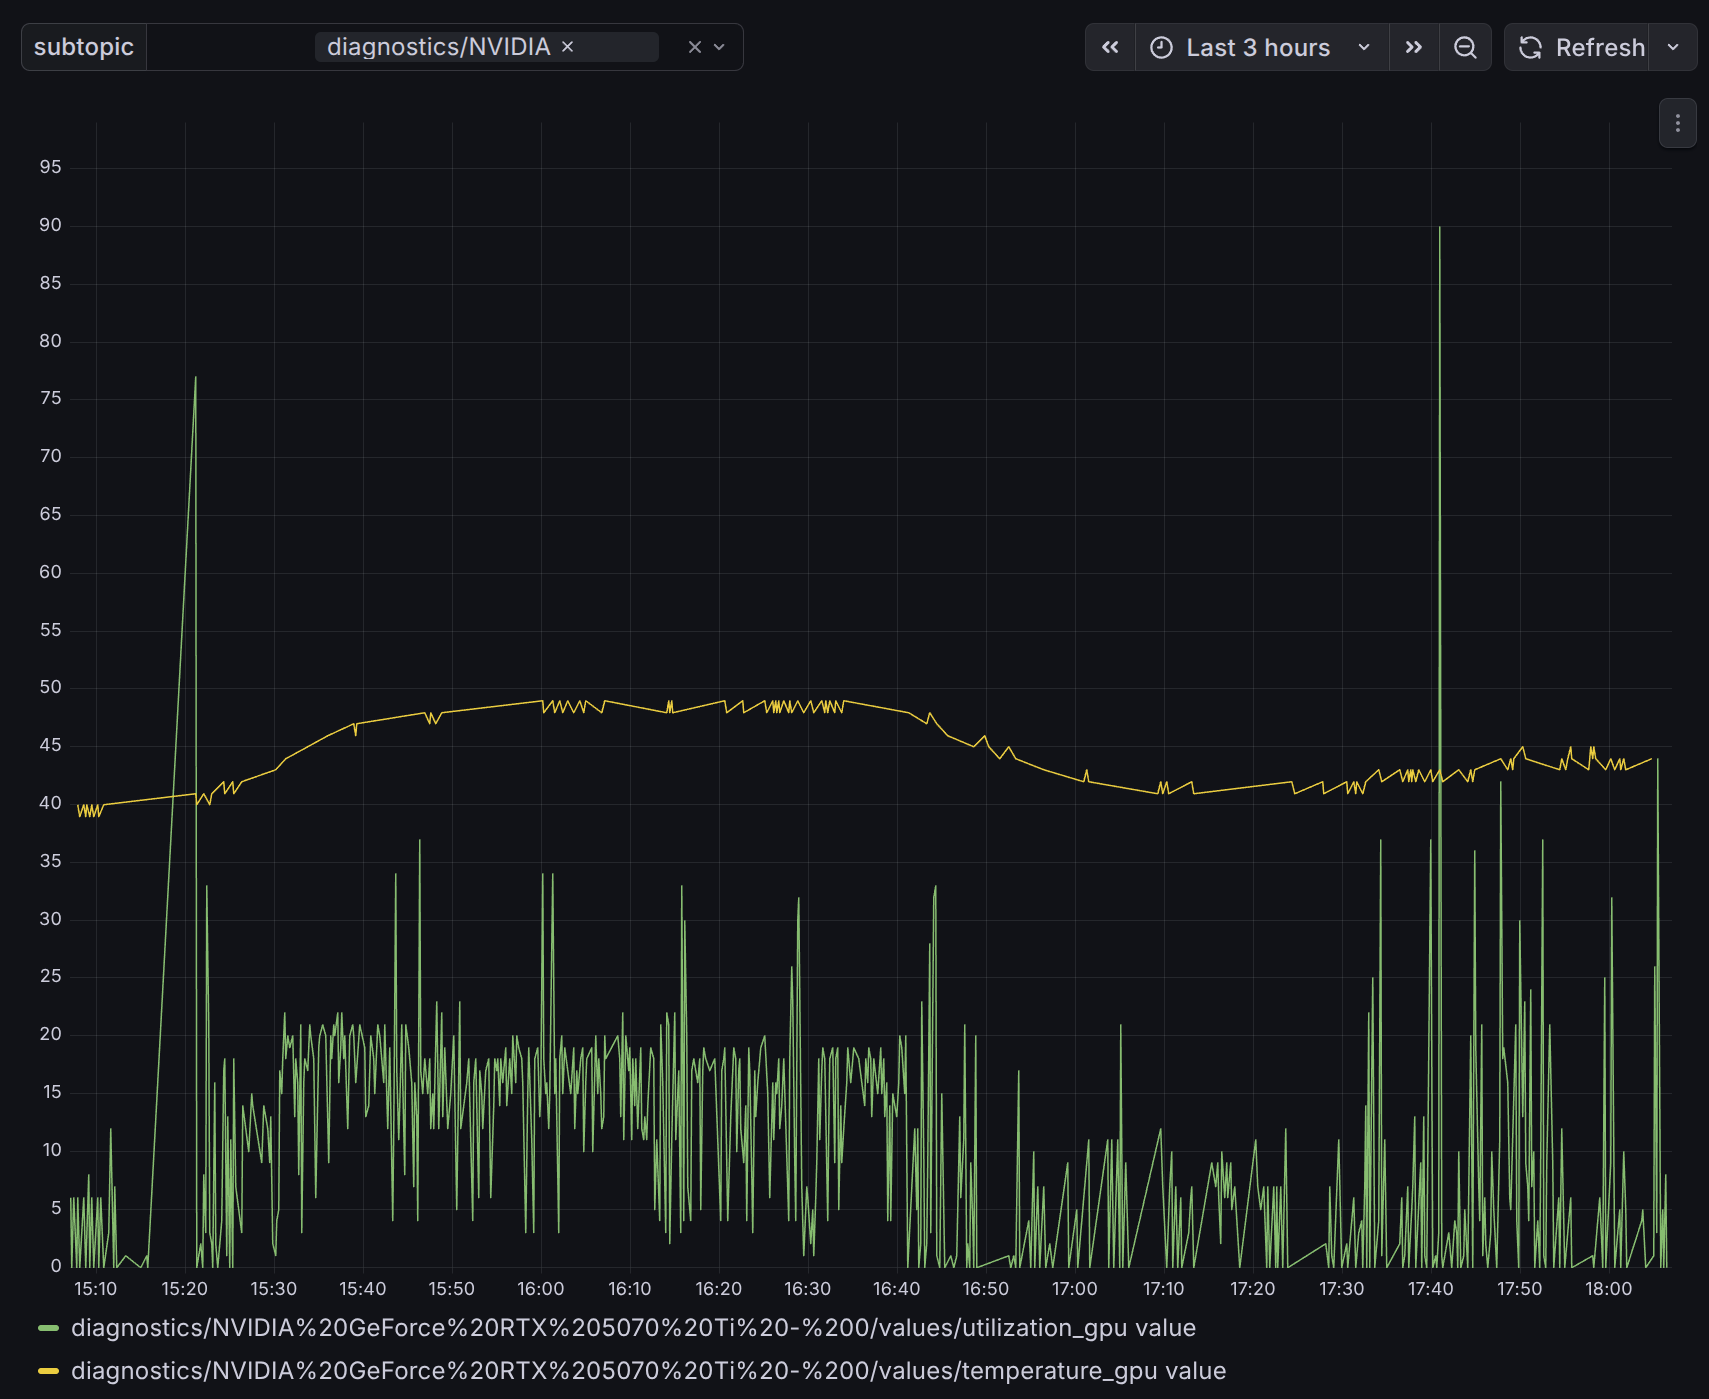
In addition to the Transitive user specific Grafana organization, Transitive also provisions and maintains a shared, reusable MQTTSync History Dashboard in Grafana that allows for the URL-defined generation of timeline visualizations of data stored in the mqtt_history ClickHouse table described in the previous section.
The configuration of this shared dashboard is both flexible and secure. It takes two inputs from the URL parameter:
- a JWT that is limits access to just one specific Transitive user/organization, device, and capability, and
- a MQTT topic to visualize.
Based on these parameters, capabilities can programmatically generate dynamic links to visualizations like this one and can even embed these visualizations in UI the components that Transitive users can, in turn, embed in their own web dashboards.
Embedding into your own web dashboards
One of the most distinguishing features of the Transitive framework is, of course, the ability to embed all capability-secific web UI components into other web applications and dashboards. The URL-based, JWT-authenticated mechanism for temporarily sharing Grafana visualizations described here continues this design philosophy of embeddable components. Because these URLs are self-contained, and because of the way we have configured the Grafana instances that ships with Transitive, you can directly use these URLs in iframes to embed them anywhere you like. Similarly, capability authors can choose to embed them directly in the UI components they expose with their capabilities.
Capability provisioned assets
The third integration point between Transitive and Grafana is a mechansim for Transitive capabilities to auto-provision assets in Grafana for those users that run these capabilities. Staying with our example about Health Monitoring, this capability, for instance, adds a template alert rule to the Grafana organization of any Transitive user that has the Health Monitoring capability installed on any of they robots.
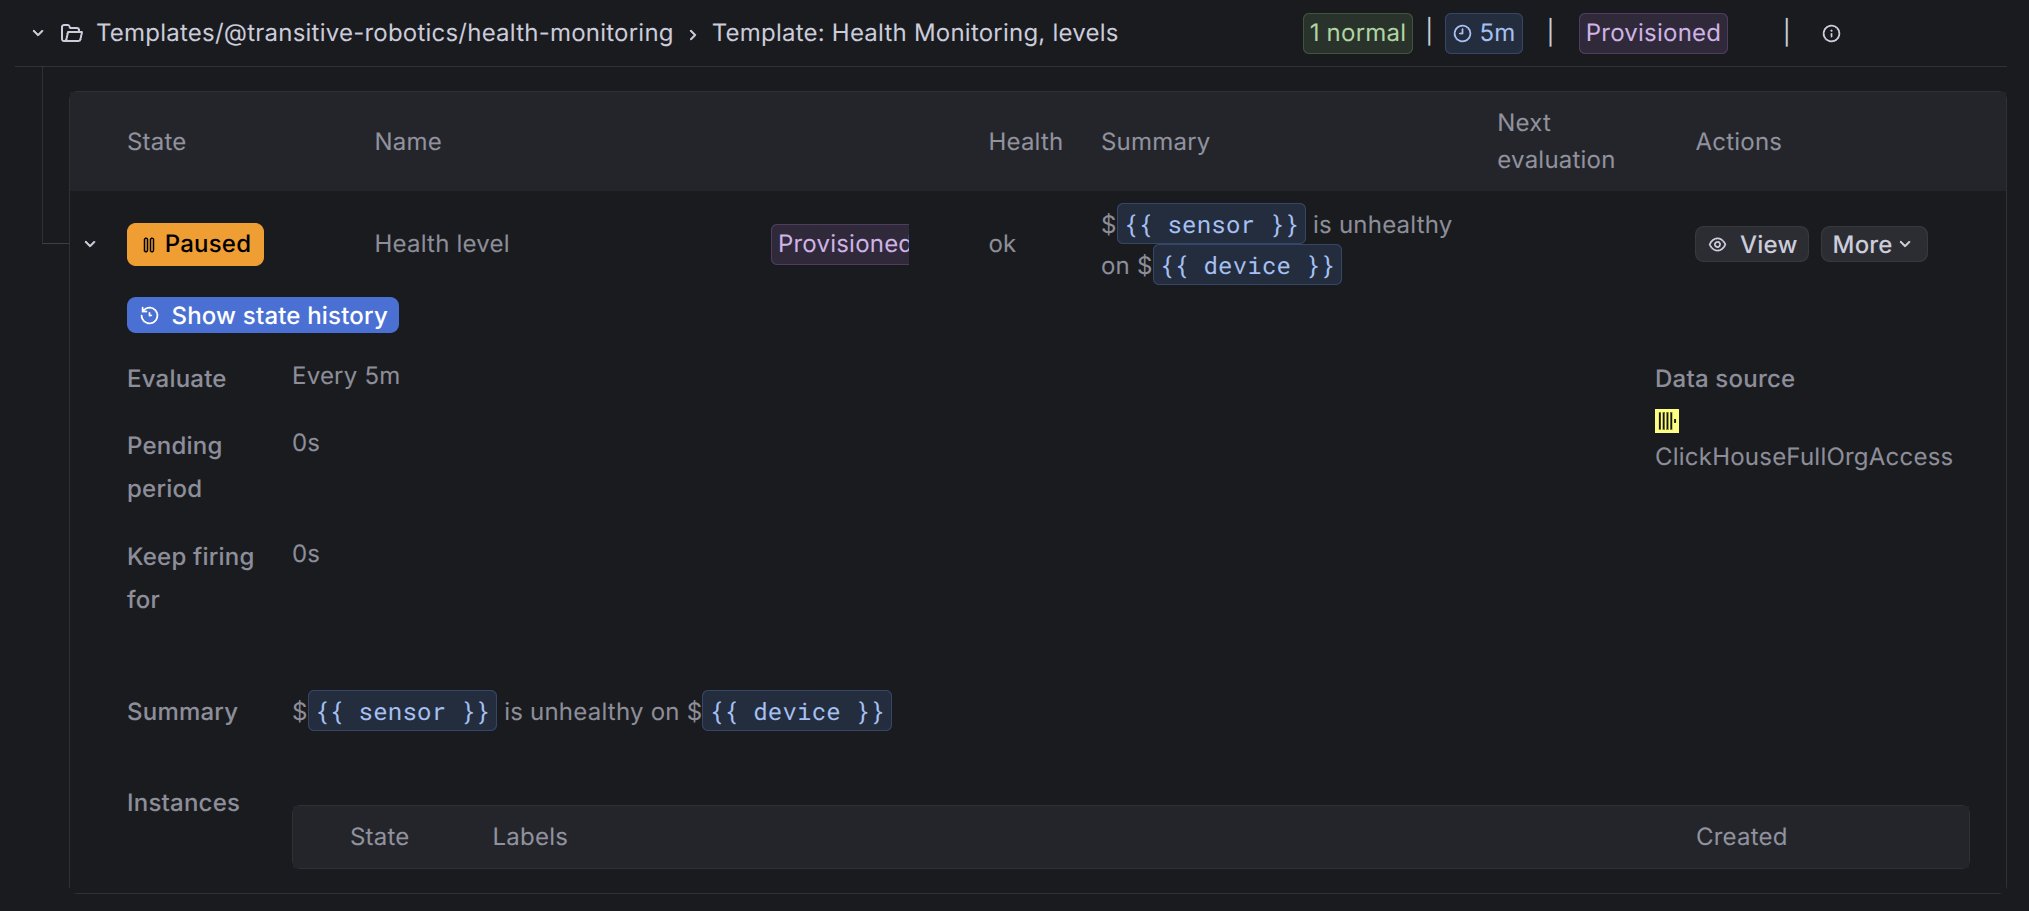
Transitive users can log into their Grafana account to make copies of these alerts and configure them with contact points where they want to be notified when the alerts trigger, e.g., Slack or PagerDuty. More about alerts in the next section.
These integrations are meant to reduce the burden of learning about and configuring Grafana, in-line with what Transitive aims to accomplish overall: saving you time and avoiding pitfalls in setting up your robotics operation stack and developing features. At the same time nothing is hidden from you and with full Editor access, power-users are still able to accomplish what they need to.