Alert: Alertmanager
Built into Grafana is the powerful Alertmanager -- the same one used by Prometheus. It allows you to specify conditions under which to alert you or your team, and it provides you with very flexibly options for how and when to receive those alerts. See Supported contact point integrations in the Grafana documentation for a complete list.
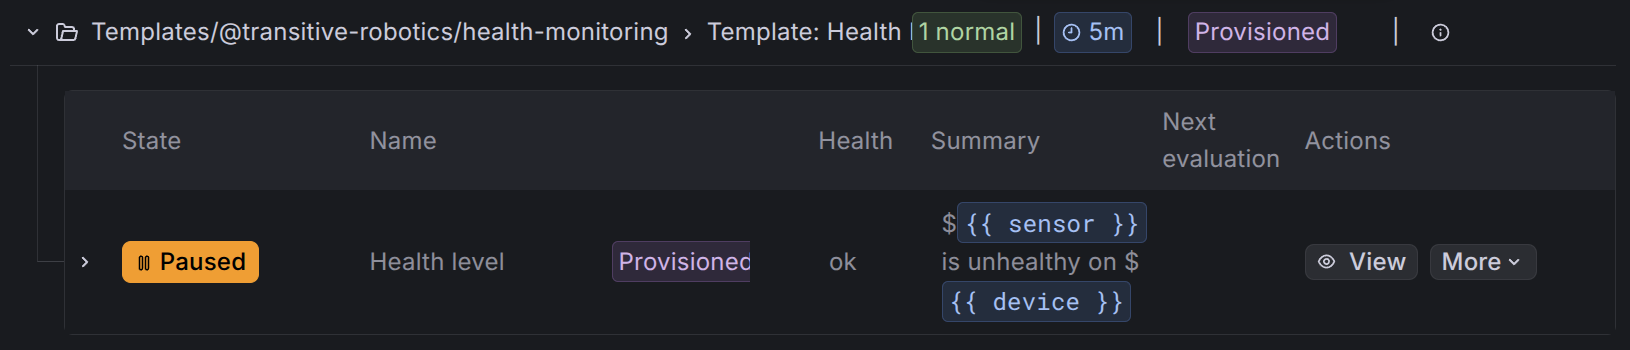
Based on the ready-to-go per-user organizations automatically created in the Grafana instance integrated into Transitive you can get going without the need to configure anything. The data-source is already there and as described in the previous section, Transitive capabilities can even auto-provision capability-specific alert templates, such as the one provided by the Health Monitoring capability to alert about unhealth robots.
Usage
To use capability-provided alert templates start by making a copy that you can edit:
Then follow the Grafana Alerting documenation to Configure contact pointes and configure notifications.
The simplest way to get started is to:

Finally save the new alert rule.
Custom alerts
Alternatively, instead of reusing a capability-provided alert template, you can define your own, custom conditions using ClickHouse SQL.
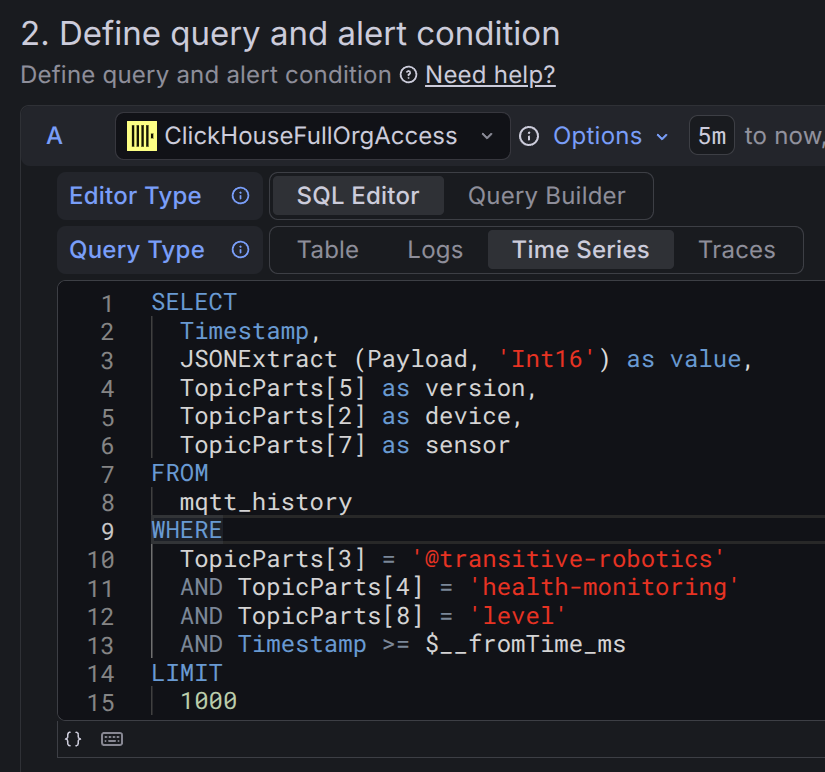
For this, we recommend you first explore the data available in your account, collected by the various capabilities you have installed, using the built-in SQL dashboard described in the ClickHouse section.