Announcing Transitive 2.0

We are thrilled to announce a new major version of Transitive, the open-source framework for full-stack robotics. Version 2.0 adds significant new integrations and features: storage of historic and time-series data in ClickHouse, visualization in Grafana, and custom alerting via Alertmanager. Some of our capabilities, like the free Health Monitoring capability, already use these features, providing significant added value to robotics companies with growing fleets.
Did I mention dark mode?
Fleet Operation at Scale
Until now Transitive has been very much focused on transactional features needed for the operation of robot fleets. This includes our most popular capabilities: WebRTC Video streaming, Remote Teleop, and ROS Tool. These capabilities are particularly empowering to robotics companies that have not yet deployed more than 50 robots. Transitive's open-source MQTTSync data protocol, its realization of full-stack packages, and the built-in fine-grained authentication and authorization features, provided a solid foundation for us to build such transactional capabilities efficiently and reliably.
But as fleets grow so do the challenges in monitoring and operating. This means that companies need tools that go beyond the direct form of one operator working on one robot at a time, but provide both longitudinal as well as historic views of the fleet. Similarly, passive monitoring and alerting need to gradually replace active monitoring by (remote) operators. Supporting robotics companies in this, second chapter of growth was our goal in this new major release, while still staying true to our philosophy of embeddability, ease of use, and fine-grained, namespaced access control.
Store: ClickHouse
There are many great open-source databases to choose from, but we found ClickHouse to be the most versatile and highest performing for the types of robotics data we have seen companies ingest, analyze, and visualize. ClickHouse is a highly-efficient, columnar data store that is already being used by many AI and robotics companies incl. Open AI, Anthropic, and Tesla. We found its column-based data layout ideal for on-disk compression as well as temporal analysis of robotics data.
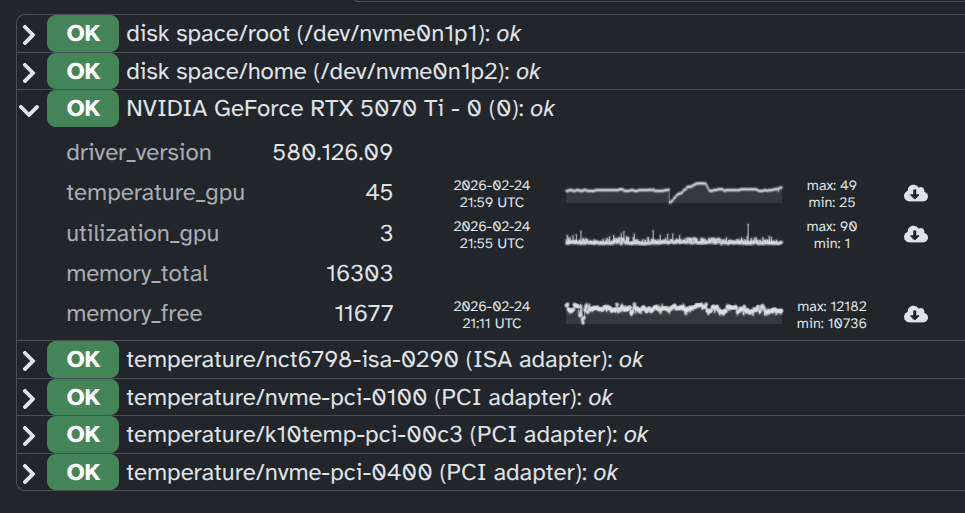
Transitive 2.0 integrates ClickHouse along multiple dimensions. First, the docker-compose file includes and configures a ClickHouse instance, adding it in both the hosted solution on transitiverobotics.com as well as any self-hosted deployments. Second, Transitive automatically provisions per-Transitive-user accounts in ClickHouse and adds the necessary ROW POLICYs to extend Transitive's namespace-based access control. Third, for developers, it provisions a designated ClickHouse database for each capability as well as several convenience functions in the @transitive-sdk/clickhouse npm package to write to and query the database. This also includes a deep integration with MQTTSync itself. Capability developers can now register specific MQTT topics to be stored in the database, and they can just as easily query this history, e.g., for simple visualizations. The Health Monitoring capability, for instance, uses this to render sparkline plots of health sensor histories directly in the UI components you can embed in your own dashboards:
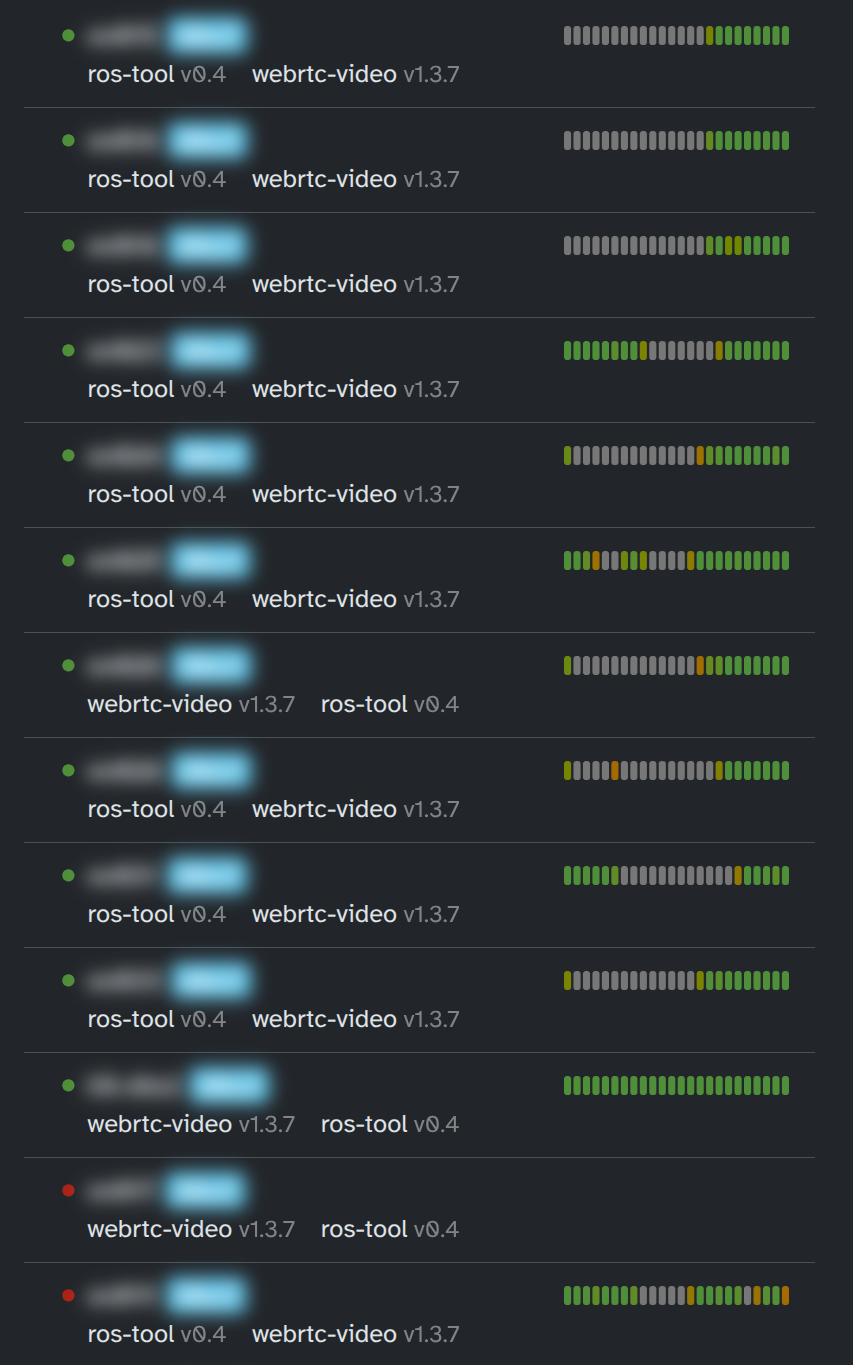
Similarly, the robot-agent itself stores and visualizes the last 24 hours of heartbeats from your robots, making it easy to see online and offline periods:
More details: Documentation – ClickHouse
Visualize: Grafana
Grafana is a popular and powerful framework for creating visualizations and data-driven dashboards, exactly what robotics companies need to get an overview of the health and operational status of their fleet. It is also well suited for diving deeper into this data, especially for plotting time-series.
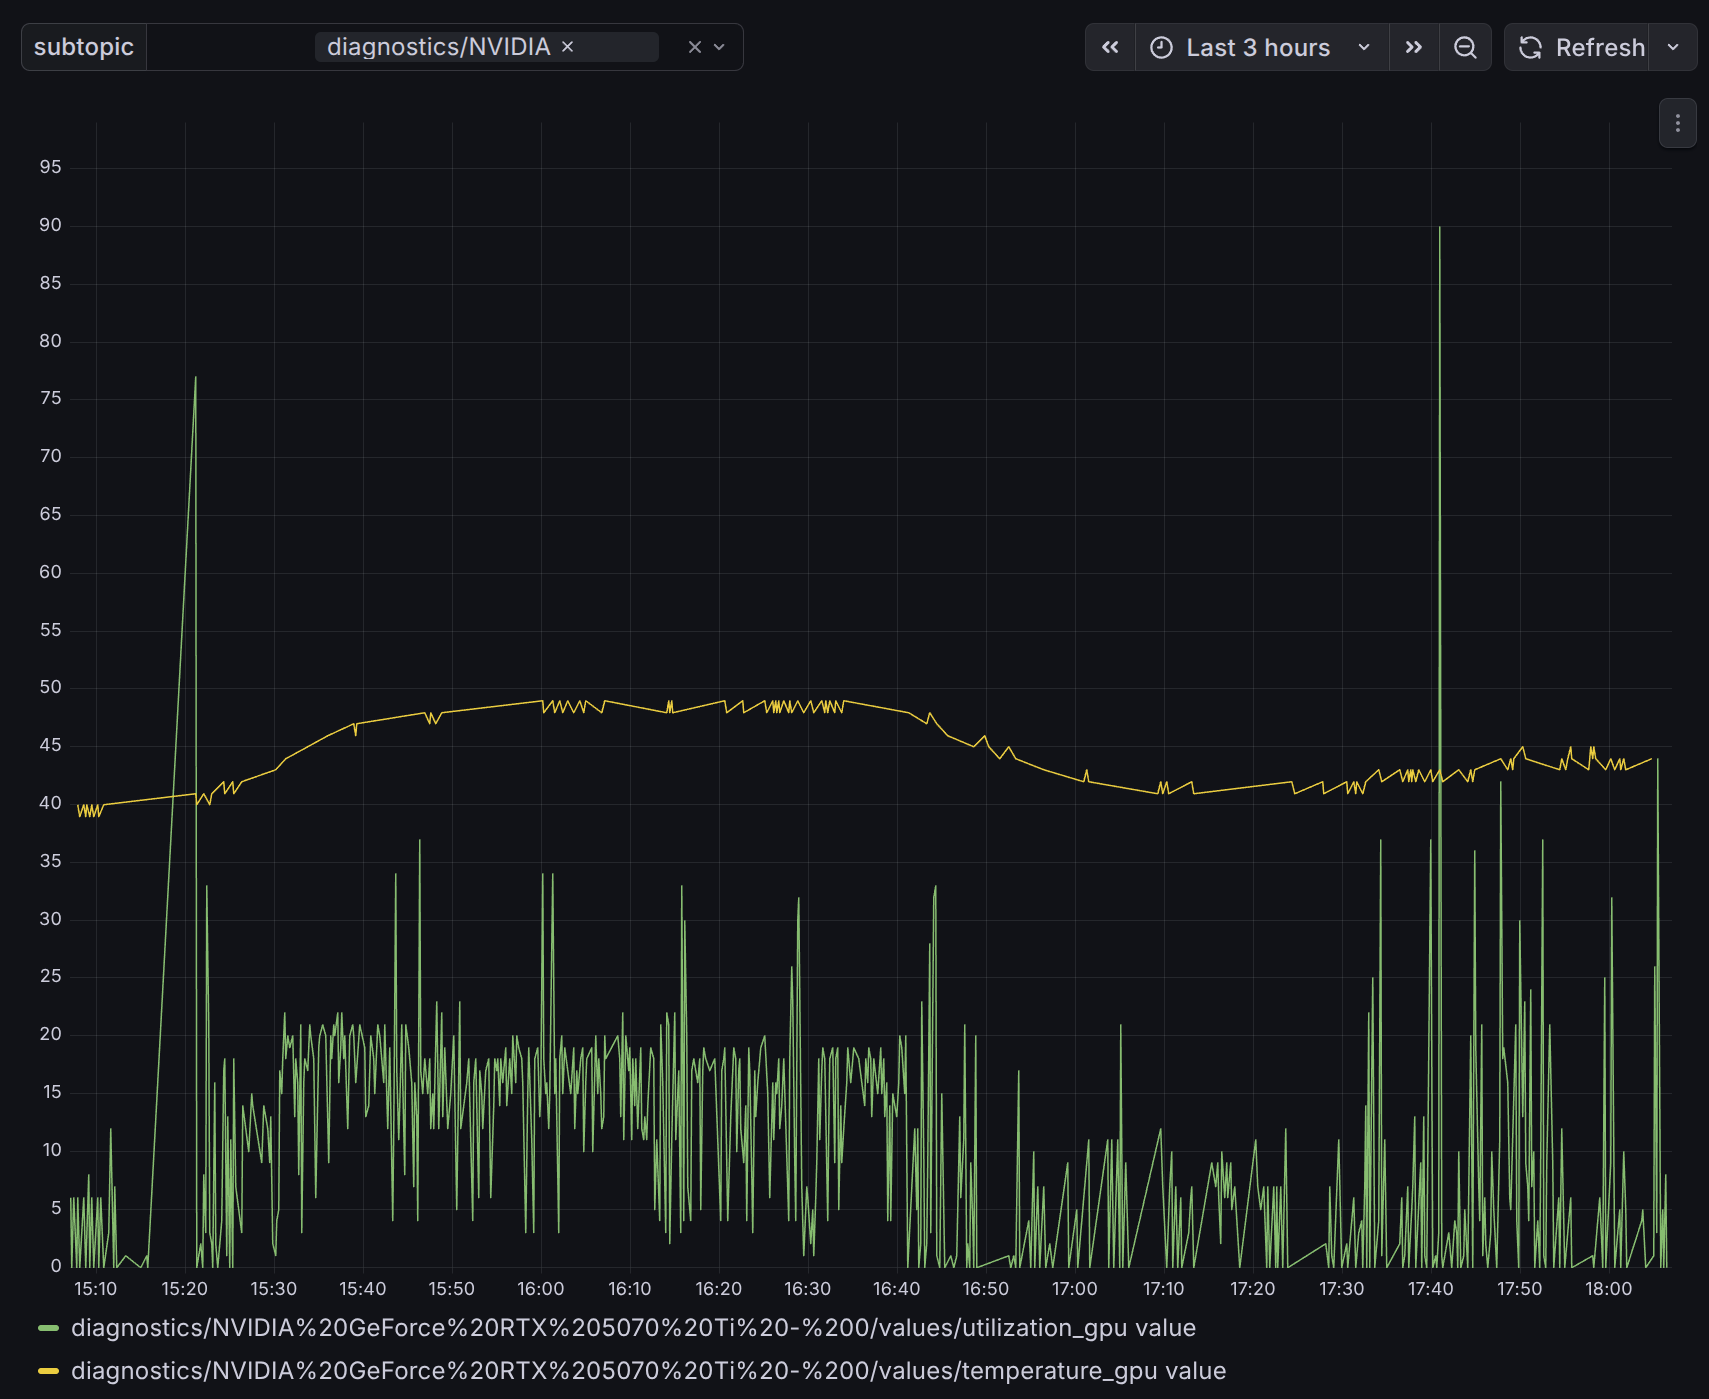
Transitive now includes a Grafana instance that uses the aforementioned ClickHouse accounts as data-source. Like the integrated ClickHouse instance it is auto-provisioned to include a separate organization for each Transitive user, both in hosted as well as self-hosted. Access control is configured to mirror the same principles as used elsewhere in Transitive: orthogonal per-user/-device and/or per-capability permissions. Among them is the ability to provide short-term access to capability and device specific plots of historic MQTT data, all encoded in a versatile URL. This URL, which capabilities can programmatically generate on-the-fly, is used to embed Grafana visualizations or to link to a full dashboard the user can use to explore further. Here is an example visualizing ROS diagnostics data plotting GPU temperature and utilization.
Transitive capabilities can further provision capability-specific assets directly into Grafana now, to provide users with custom dashboards and alert templates that the capability author deems useful for working with the data collected by the capability.
More details: Documentation – Grafana
Alert: Alertmanager
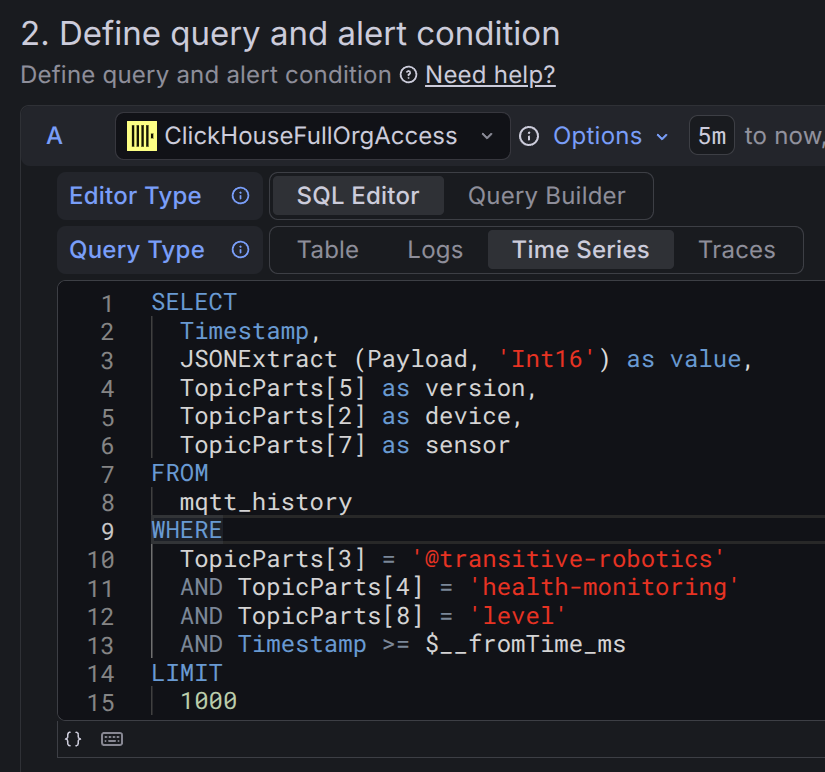
Included with Grafana is the powerful Alertmanager, the same one used by Prometheus. It can be thought of as a switchboard: data in, notifications out, with intelligent routing in the middle. Its integration into Transitive means that you can define complex SQL queries against your MQTT and capability-specific data in ClickHouse that trigger alerts. Separately, you can define specific policies for notifying specific "contact points" such as Slack, PagerDuty, or custom webhooks when these alerts trigger.
The Health Monitoring capability demonstrates one use of this. It automatically provisions an alert template that users can copy and configure to receive notifications when a robot has become unhealthy and may require attention.
More details: Documentation – Alerts
Try it out!
If you are a user of our hosted solution, there is nothing you need to do to try out these new features, they are already included in the capabilities you use. If you are using Health Monitoring, for example, you will already see all the above mentioned features, which will let you explore your recent ROS /diagnostics history, visualize it, define your own dashboards around it, and configure alerts. If you are not yet using Transitive, you can create a free account and install these capabilities on your robots.
If you prefer to self-host Transitive in your own cloud, on-prem, or directly on your robots for offline-use, you can follow our instructions for self-hosting to bring up the Transitive stack in your dev environment where you can also start writing your own capabilities. If you do, please let us know and consider submitting your capability to the official capability store if it's something that might be useful to others, too.
Finally, if you have questions, email us or ask them in our community Slack, we always respond.