Health Monitoring
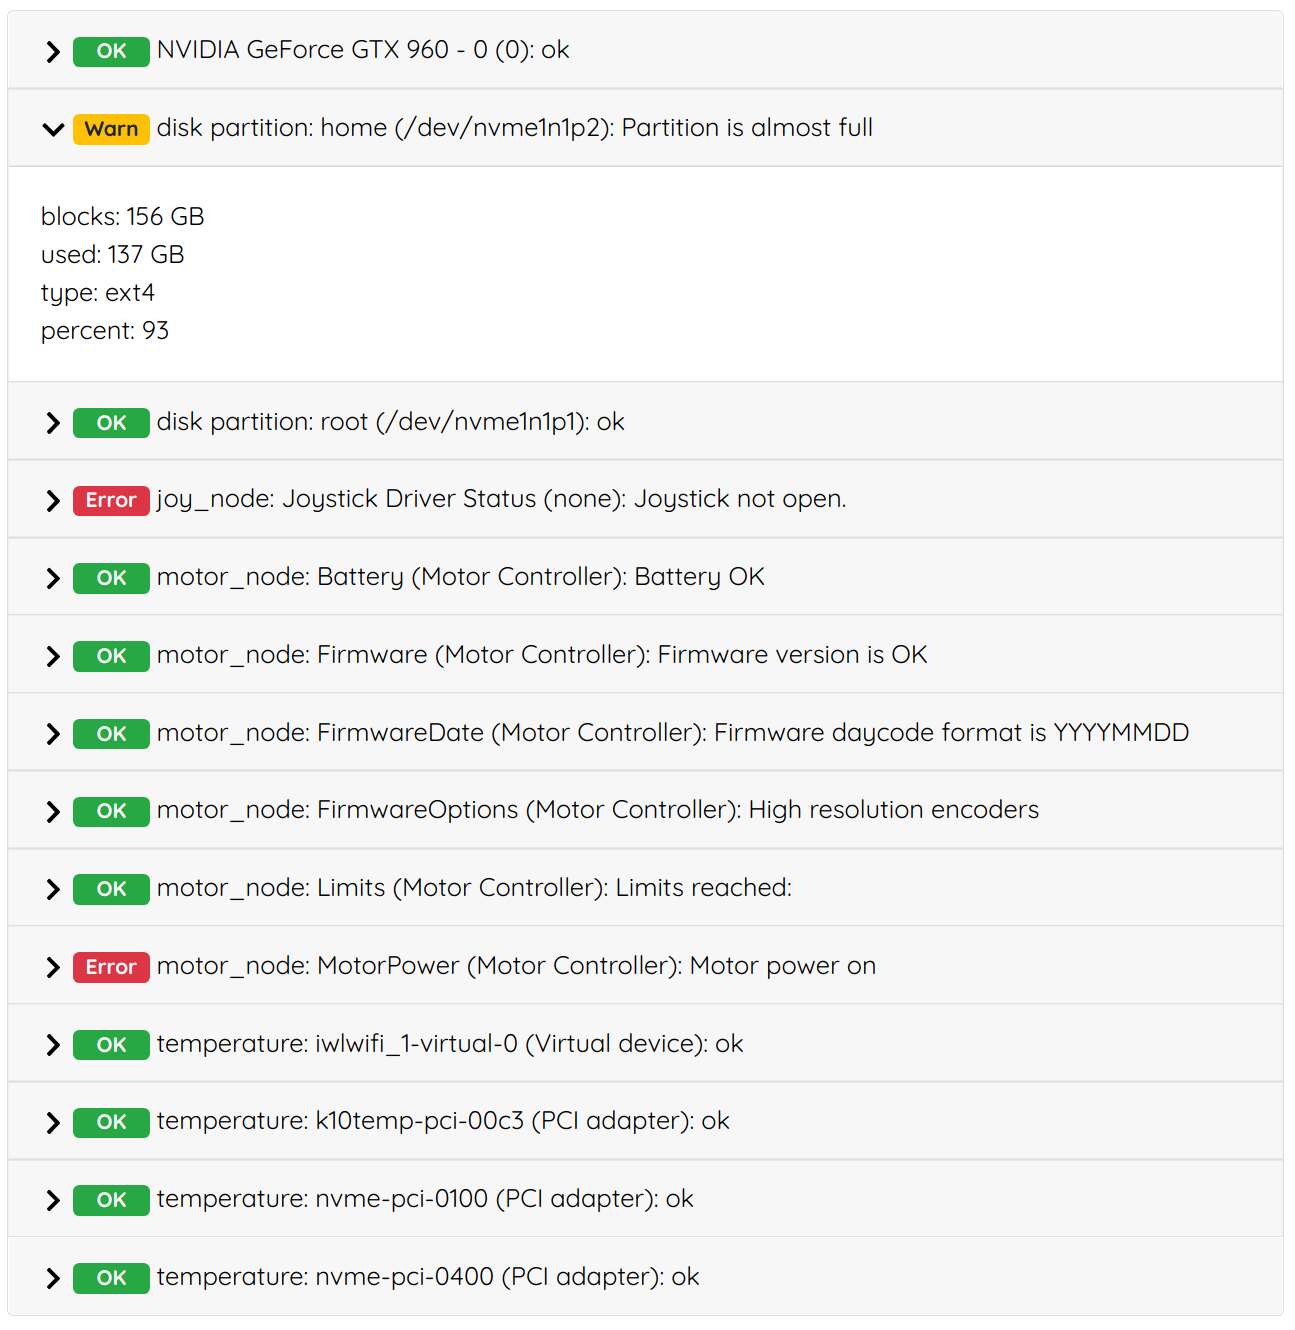
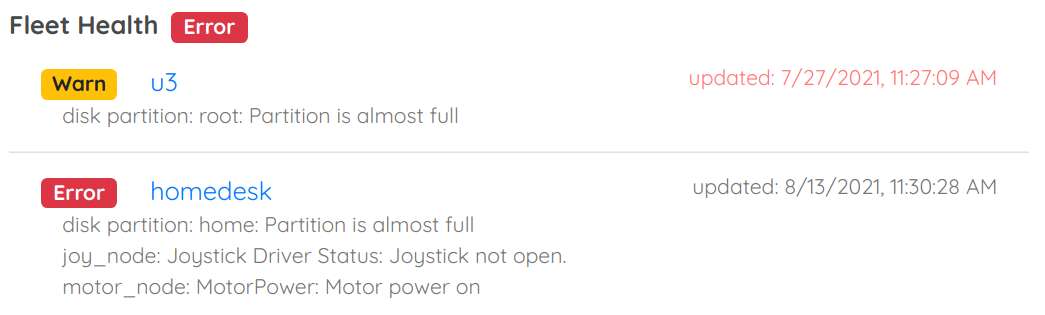
Aggregates diagnostics data from devices, synchronizes them with the cloud, and aggregates them for easy monitoring. On the robot the capability collects diagnostics from the ROS /diagnostics topic as well as some hard-coded OS level metrics (ping timings, CPU temperature, GPU temperature (NVIDIA only), and available disk space).
Works with both ROS 1 and ROS 2, even simulatenously if desired.
Basic Network Health
Built into the capability itself, i.e., not requiring you to publish to /diagnostics, is a simple ping-monitor. It pings one of our servers 30 times a minute and reports aggregate results for each minute:
- percentage of successful pings
- min/avg/max ping timings
Health History
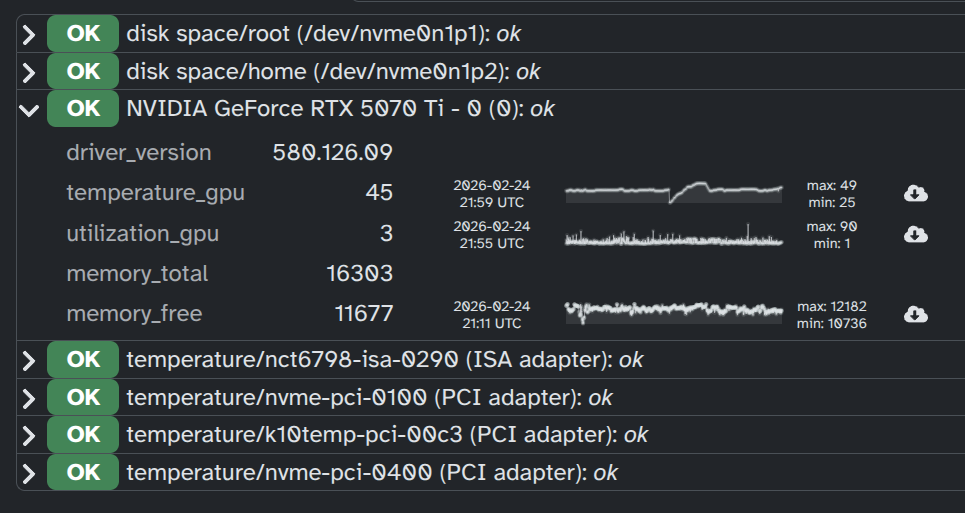
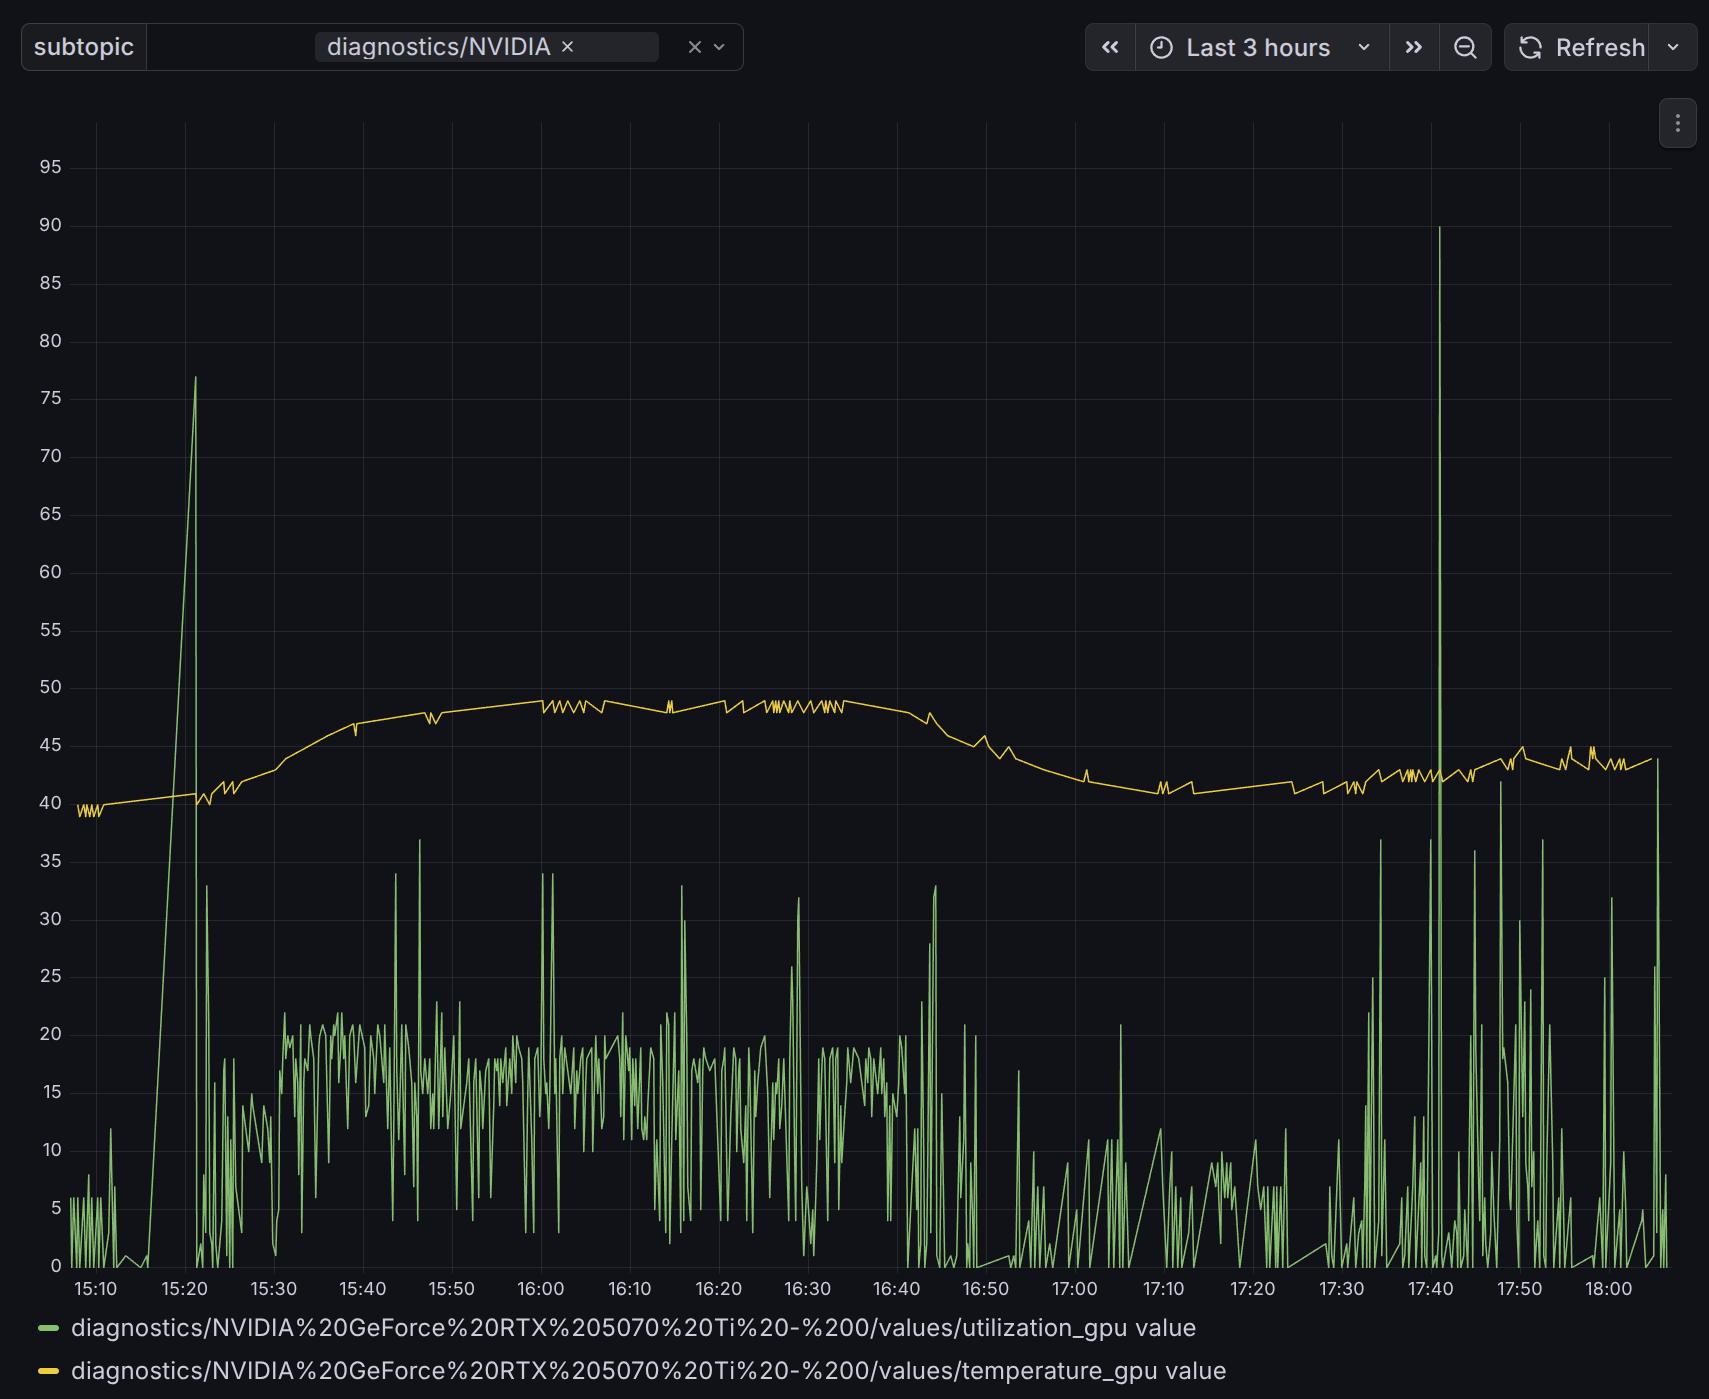
The capability stores historic values in ClickHouse, shows them as in-line spark-lines in the UI and allows you to download them as JSON.
Clicking the sparkline plot opens it in Grafana.
Dependencies
ros-DISTRO-diagnostic-msgsfor the ROS distro you useiputils-pingfor the ping monitor to worklm-sensorsfor temperate sensors to work
Details